Jefferson County, Texas: Texan Right county. In 2024, voted R+9%. Democratic peak: D+75 in 1936.
Key facts
- 2024 presidential margin
- R+9MIT Election Lab
- Political typology
- Texan RightAkashic typology
- Population
- 253,8782024 5-year
- Median household income
- $60,0262024 5-year
- White (non-Hispanic)
- 40.2%2024 5-year
- Black
- 33.0%2024 5-year
- Hispanic / Latino
- 24.1%2024 5-year
- Peak Democratic margin
- D+75 in 1936MIT Election Lab
- Peak Republican margin
- R+21 in 1972MIT Election Lab
- Most similar
- McCormick County, SC · similarity 0.96
| Donald Trump ✓Republican | 53.9% | 46,596 |
|---|---|---|
| Kamala HarrisDemocratic | 45.0% | 38,936 |
| OtherAll other candidates | 1.0% | 901 |
| Year | Margin (D minus R) |
|---|---|
| 1876 | No data |
| 1880 | No data |
| 1884 | No data |
| 1888 | No data |
| 1892 | No data |
| 1896 | No data |
| 1900 | No data |
| 1904 | No data |
| 1908 | No data |
| 1912 | +63.3% |
| 1916 | +69.1% |
| 1920 | +48.6% |
| 1924 | +14.7% |
| 1928 | −13.6% |
| 1932 | +64.9% |
| 1936 | +75.2% |
| 1940 | +60.3% |
| 1944 | +60.3% |
| 1948 | +49.9% |
| 1952 | +7.3% |
| 1956 | −9.1% |
| 1960 | +15.8% |
| 1964 | +21.5% |
| 1968 | +5.2% |
| 1972 | −21.0% |
| 1976 | +18.8% |
| 1980 | +10.5% |
| 1984 | +9.7% |
| 1988 | +21.7% |
| 1992 | +19.7% |
| 1996 | +15.4% |
| 2000 | +5.9% |
| 2004 | +2.9% |
| 2008 | +2.2% |
| 2012 | +1.6% |
| 2016 | −0.5% |
| 2020 | −1.6% |
| 2024 | −8.9% |
| Year | Won | Margin | Democratic | Republican | Total |
|---|---|---|---|---|---|
| R | 38,936 | 46,596 | 86,433 | ||
| R | 46,073 | 47,570 | 94,759 | ||
| R | 42,443 | 42,862 | 87,618 | ||
| D | 44,668 | 43,242 | 88,735 | ||
| D | 44,888 | 42,905 | 88,296 | ||
| D | 47,066 | 44,423 | 91,866 | ||
| D | 45,409 | 40,320 | 86,909 | ||
| D | 45,854 | 32,821 | 84,426 | ||
| D | 48,405 | 29,622 | 95,543 | ||
| D | 55,649 | 35,754 | 91,693 | ||
| D | 54,846 | 45,124 | 100,215 | ||
| D | 45,642 | 36,763 | 84,602 | ||
| D | 47,581 | 32,451 | 80,546 | ||
| R | 29,909 | 45,819 | 75,837 | ||
| D | 30,032 | 26,007 | 77,868 | ||
| D | 44,584 | 28,771 | 73,594 | ||
| D | 40,533 | 29,395 | 70,331 | ||
| R | 25,057 | 30,102 | 55,429 | ||
| D | 29,384 | 25,363 | 54,795 | ||
| D | 22,475 | 5,749 | 33,514 | ||
| D | 22,066 | 4,525 | 29,080 | ||
| D | 19,694 | 4,860 | 24,591 | ||
| D | 18,187 | 2,544 | 20,808 | ||
| D | 17,129 | 3,584 | 20,865 | ||
| R | 7,006 | 9,209 | 16,231 | ||
| D | 5,925 | 4,348 | 10,756 | ||
| D | 4,246 | 1,110 | 6,450 | ||
| D | 3,082 | 488 | 3,756 | ||
| D | 1,703 | 187 | 2,395 | ||
| — | — | — | — | ||
| — | — | — | — | ||
| — | — | — | — | ||
| — | — | — | — | ||
| — | — | — | — | ||
| — | — | — | — | ||
| — | — | — | — | ||
| — | — | — | — | ||
| — | — | — | — |
Demographics
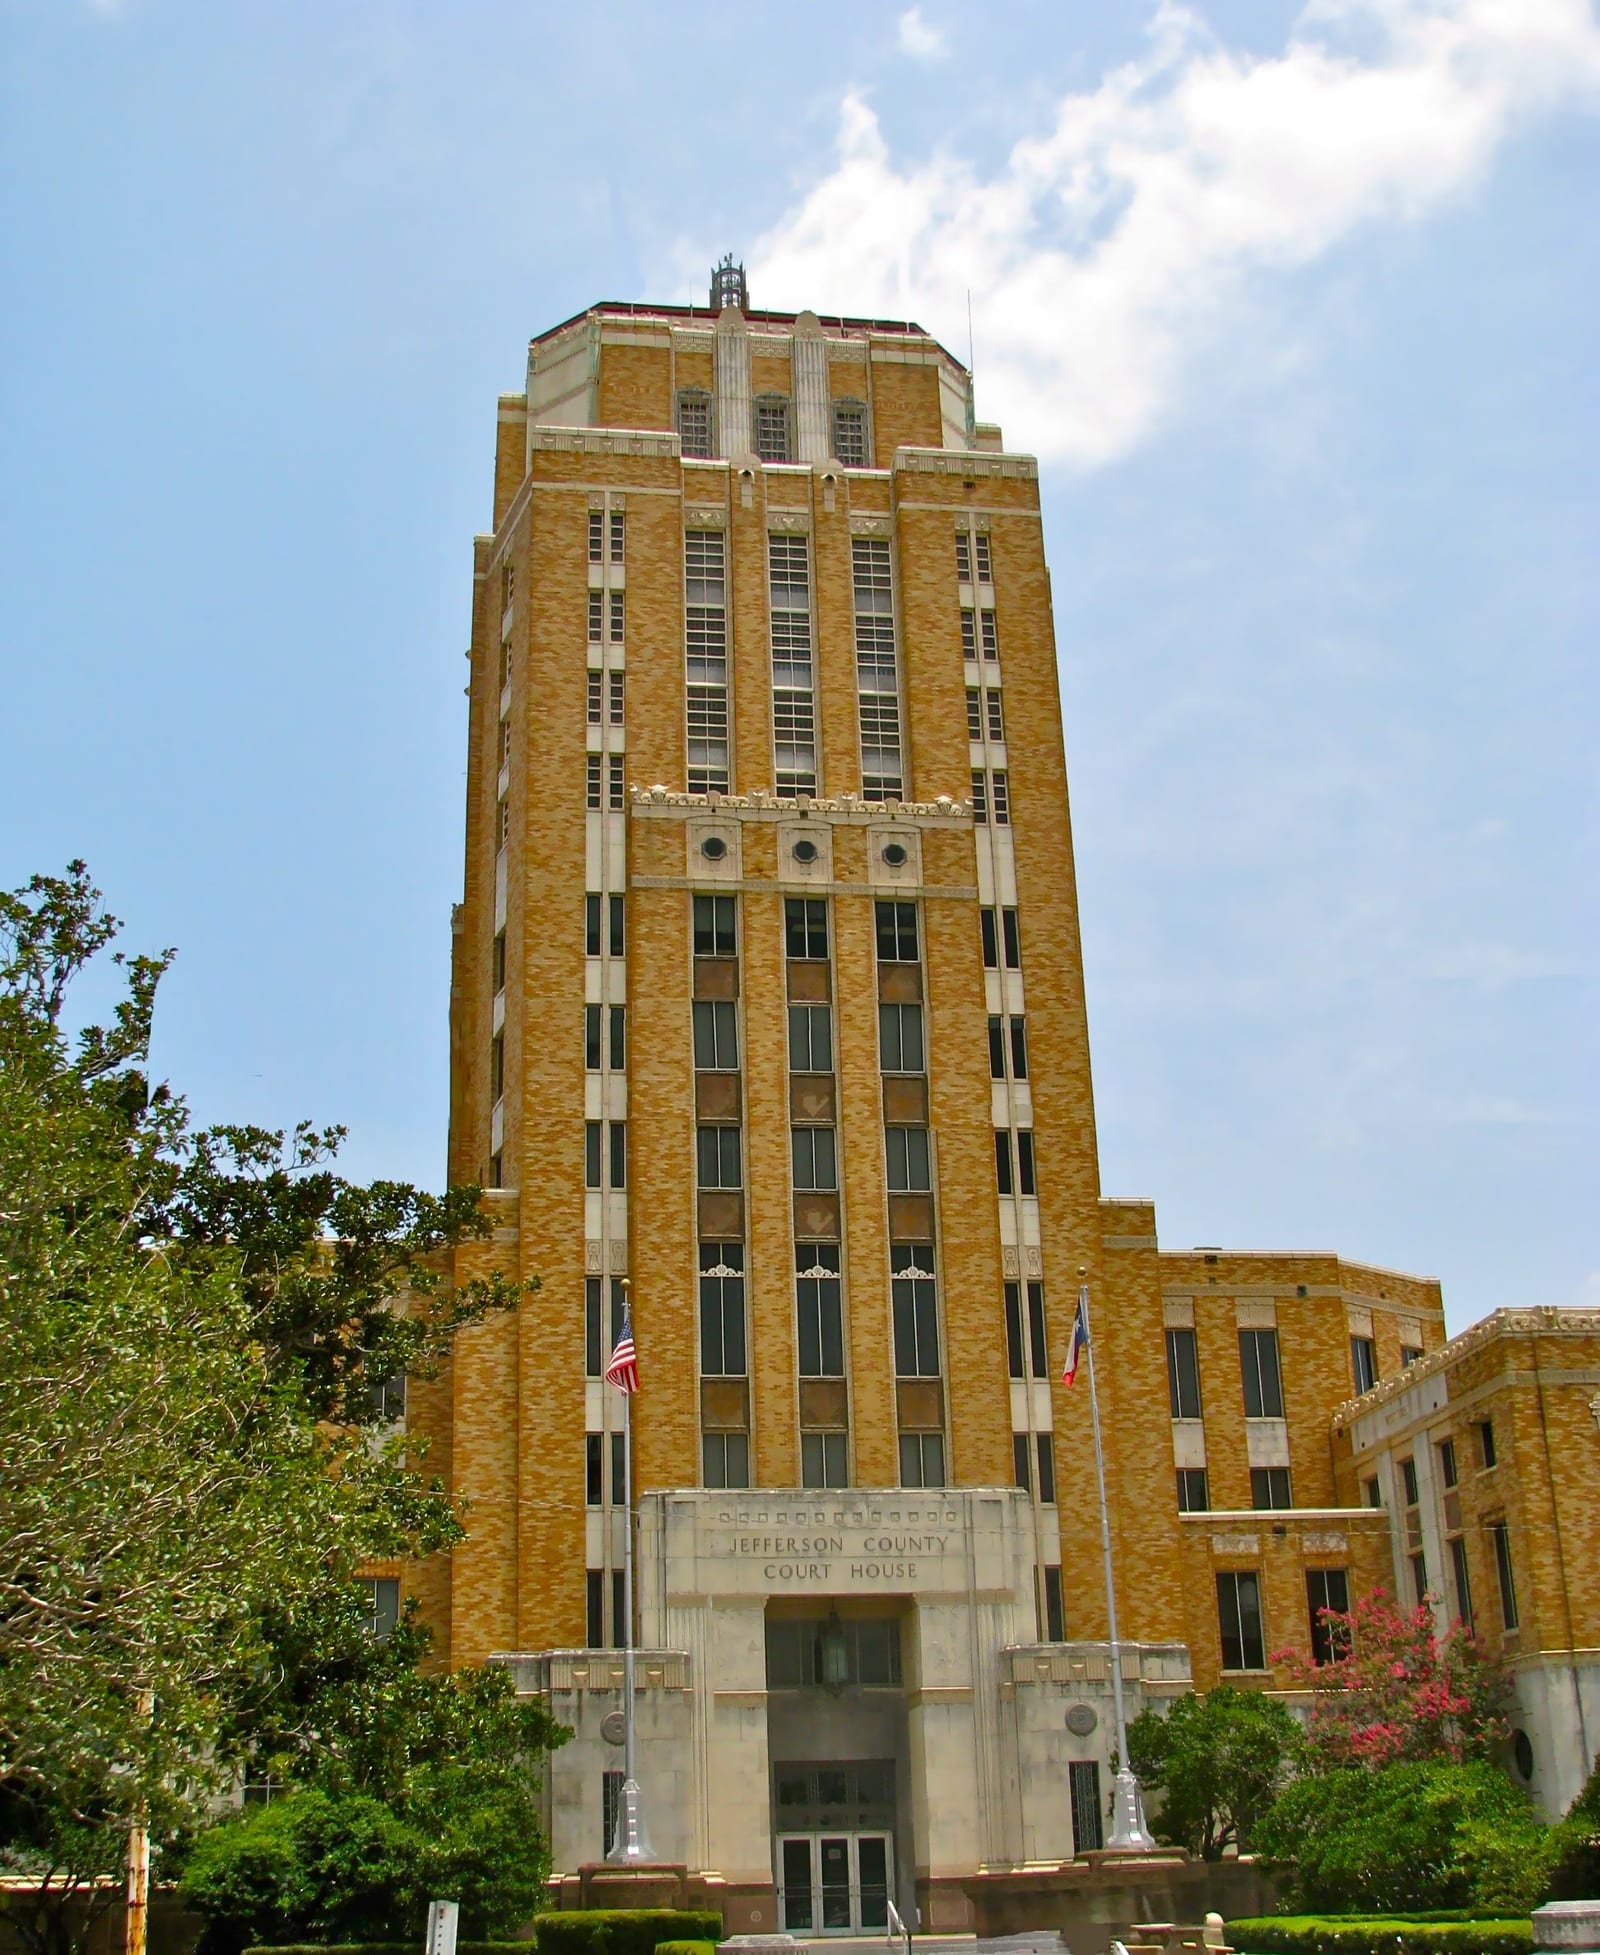
Jefferson County, home to Beaumont and the Sabine-Neches petrochemical corridor, delivered Democratic presidential margins as recently as 2008 but has shifted rightward in each subsequent cycle, reflecting broader working-class realignment along the upper Texas coast.
The Republican margin here reached twenty-one points in 1972. Between 2020 and 2024 the county moved seven points toward the Republican candidate; the 2024 margin was nine points.
A population of 253,878, a 40% non-Hispanic-white share, and a median household income of $60,026 describe the county. The county's voting pattern over the last decade is most similar to that of McCormick County and Las Animas County. A non-English-speaking share of 23% reflects a meaningful Latino presence that votes, here, with the Republican grain.
Compare two places, side by side
Twelve curated comparisons line up election history, demographics, and the divergence story for two places at a glance. Browse all comparisons →
Jefferson County, Texas. Akashic. https://akashic.app/county/48245/. Accessed May 20, 2026. License: CC BY 4.0.