Danville city, Virginia: Black Belt county. In 2024, voted D+21%. Republican peak: R+79 in 1972.
Key facts
- 2024 presidential margin
- D+21MIT Election Lab
- Political typology
- Black BeltAkashic typology
- Population
- 42,2142024 5-year
- Median household income
- $44,4232024 5-year
- White (non-Hispanic)
- 39.8%2024 5-year
- Black
- 51.0%2024 5-year
- Hispanic / Latino
- 5.6%2024 5-year
- Peak Democratic margin
- D+77 in 1912MIT Election Lab
- Peak Republican margin
- R+79 in 1972MIT Election Lab
- Most similar
- Charles County, MD · similarity 0.97
| Kamala Harris ✓Democratic | 59.9% | 10,615 |
|---|---|---|
| Donald TrumpRepublican | 38.9% | 6,894 |
| OtherAll other candidates | 1.1% | 203 |
| Year | Margin (D minus R) |
|---|---|
| 1876 | No data |
| 1880 | No data |
| 1884 | No data |
| 1888 | No data |
| 1892 | +26.8% |
| 1896 | +21.7% |
| 1900 | +64.1% |
| 1904 | +75.1% |
| 1908 | +63.7% |
| 1912 | +77.2% |
| 1916 | +61.7% |
| 1920 | +54.0% |
| 1924 | +49.3% |
| 1928 | −32.7% |
| 1932 | +49.4% |
| 1936 | +70.7% |
| 1940 | +61.3% |
| 1944 | +43.3% |
| 1948 | +13.9% |
| 1952 | −17.7% |
| 1956 | −27.9% |
| 1960 | −30.2% |
| 1964 | −33.8% |
| 1968 | −13.6% |
| 1972 | −79.0% |
| 1976 | −22.1% |
| 1980 | −26.1% |
| 1984 | −34.7% |
| 1988 | −24.5% |
| 1992 | −7.4% |
| 1996 | −5.9% |
| 2000 | −6.6% |
| 2004 | +0.2% |
| 2008 | +19.1% |
| 2012 | +22.1% |
| 2016 | +19.8% |
| 2020 | +22.1% |
| 2024 | +21.0% |
| Year | Won | Margin | Democratic | Republican | Total |
|---|---|---|---|---|---|
| D | 10,615 | 6,894 | 17,712 | ||
| D | 11,710 | 7,428 | 19,389 | ||
| D | 11,059 | 7,303 | 18,940 | ||
| D | 12,218 | 7,763 | 20,204 | ||
| D | 12,352 | 8,361 | 20,890 | ||
| D | 9,436 | 9,399 | 19,112 | ||
| R | 8,221 | 9,427 | 18,307 | ||
| R | 8,168 | 9,254 | 18,519 | ||
| R | 8,134 | 9,584 | 19,661 | ||
| R | 7,353 | 12,221 | 19,874 | ||
| R | 5,846 | 12,141 | 18,161 | ||
| R | 6,138 | 10,665 | 17,362 | ||
| R | 6,425 | 10,235 | 17,212 | ||
| R | 541 | 5,304 | 6,028 | ||
| R | 4,495 | 6,796 | 16,874 | ||
| R | 1,198 | 2,420 | 3,620 | ||
| R | 2,611 | 4,966 | 7,794 | ||
| R | 2,409 | 4,561 | 7,726 | ||
| R | 3,323 | 4,765 | 8,146 | ||
| D | 2,334 | 1,579 | 5,448 | ||
| D | 3,121 | 1,231 | 4,366 | ||
| D | 3,324 | 787 | 4,141 | ||
| D | 3,266 | 549 | 3,845 | ||
| D | 2,264 | 740 | 3,084 | ||
| R | 1,196 | 2,360 | 3,556 | ||
| D | 1,577 | 473 | 2,241 | ||
| D | 1,888 | 551 | 2,476 | ||
| D | 1,151 | 229 | 1,495 | ||
| D | 1,066 | 93 | 1,260 | ||
| D | 963 | 206 | 1,189 | ||
| D | 836 | 101 | 979 | ||
| D | 1,575 | 310 | 1,973 | ||
| D | 1,702 | 1,078 | 2,872 | ||
| D | 1,234 | 710 | 1,956 | ||
| — | — | — | — | ||
| — | — | — | — | ||
| — | — | — | — | ||
| — | — | — | — |
Demographics
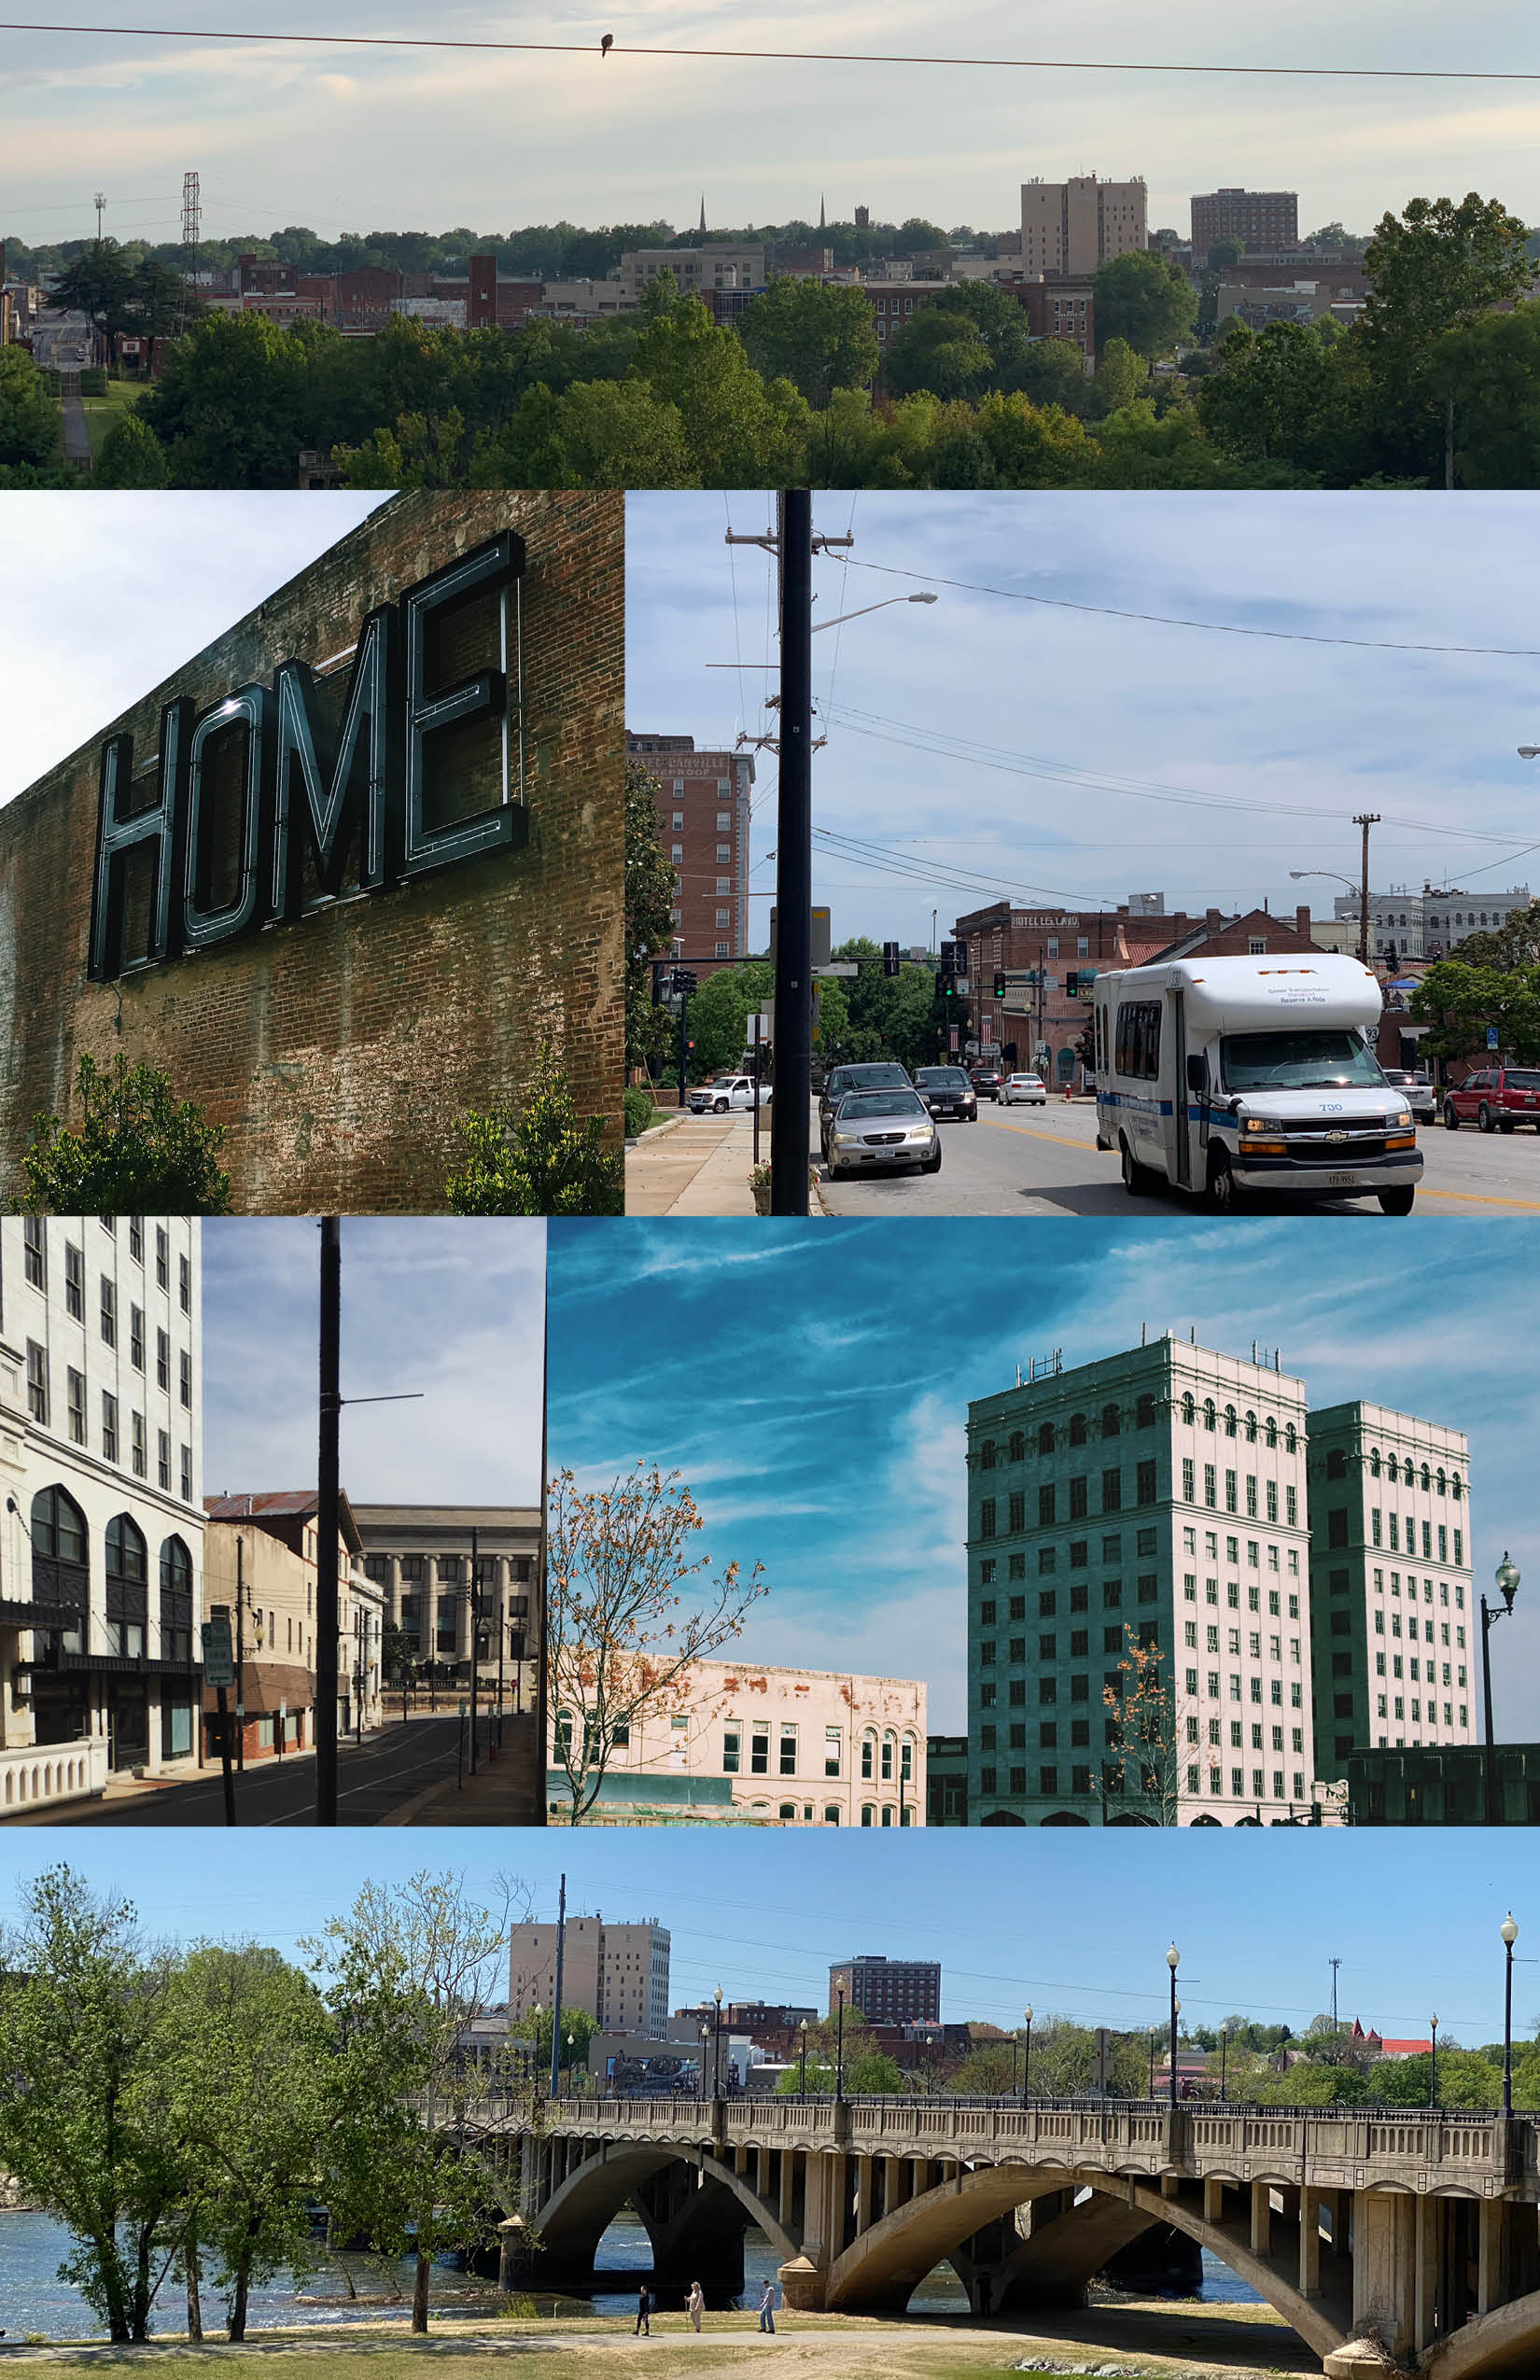
Danville, a former textile hub on the North Carolina border, has shifted decisively toward Democrats over the past two decades as its population has grown majority-Black and its manufacturing base has contracted.
The Democratic margin here reached seventy-seven points in 1912. Between 2020 and 2024 the county moved one point toward the Republican candidate; the 2024 margin was twenty-one points. The recent movement, modest against a deep Democratic baseline, mirrors a broader rightward drift across the Black Belt.
The economic context is part of the story: a median household income of $44,423 and a 25% poverty rate. The county's voting pattern over the last decade is most similar to that of Charles County and Manassas Park city.
Compare two places, side by side
Twelve curated comparisons line up election history, demographics, and the divergence story for two places at a glance. Browse all comparisons →
Danville city, Virginia. Akashic. https://akashic.app/county/51590/. Accessed May 20, 2026. License: CC BY 4.0.