Hopewell city, Virginia: Industrial Catholic Metro county. In 2024, voted D+14%. Democratic peak: D+75 in 1916.
Key facts
- 2024 presidential margin
- D+14MIT Election Lab
- Political typology
- Industrial Catholic MetroAkashic typology
- Population
- 22,9592024 5-year
- Median household income
- $54,7292024 5-year
- White (non-Hispanic)
- 41.1%2024 5-year
- Black
- 43.6%2024 5-year
- Hispanic / Latino
- 8.9%2024 5-year
- Peak Democratic margin
- D+75 in 1916MIT Election Lab
- Peak Republican margin
- R+37 in 1984MIT Election Lab
- Most similar
- Manassas city, VA · similarity 0.98
| Kamala Harris ✓Democratic | 56.3% | 5,078 |
|---|---|---|
| Donald TrumpRepublican | 42.5% | 3,838 |
| OtherAll other candidates | 1.2% | 110 |
| Year | Margin (D minus R) |
|---|---|
| 1876 | No data |
| 1880 | No data |
| 1884 | No data |
| 1888 | No data |
| 1892 | No data |
| 1896 | No data |
| 1900 | No data |
| 1904 | No data |
| 1908 | No data |
| 1912 | No data |
| 1916 | +75.0% |
| 1920 | +40.3% |
| 1924 | +14.5% |
| 1928 | −2.3% |
| 1932 | +46.6% |
| 1936 | +59.2% |
| 1940 | +52.2% |
| 1944 | +55.3% |
| 1948 | +33.9% |
| 1952 | +0.5% |
| 1956 | −14.7% |
| 1960 | −9.1% |
| 1964 | −1.5% |
| 1968 | −20.4% |
| 1972 | −33.6% |
| 1976 | −0.9% |
| 1980 | −16.8% |
| 1984 | −37.3% |
| 1988 | −28.6% |
| 1992 | −11.9% |
| 1996 | −8.9% |
| 2000 | −10.4% |
| 2004 | −8.5% |
| 2008 | +11.9% |
| 2012 | +15.9% |
| 2016 | +9.3% |
| 2020 | +14.6% |
| 2024 | +13.7% |
| Year | Won | Margin | Democratic | Republican | Total |
|---|---|---|---|---|---|
| D | 5,078 | 3,838 | 9,026 | ||
| D | 5,427 | 4,018 | 9,633 | ||
| D | 4,724 | 3,885 | 9,008 | ||
| D | 5,179 | 3,739 | 9,031 | ||
| D | 5,285 | 4,149 | 9,524 | ||
| R | 3,573 | 4,251 | 7,936 | ||
| R | 3,024 | 3,749 | 6,978 | ||
| R | 2,868 | 3,493 | 7,062 | ||
| R | 2,863 | 3,818 | 8,042 | ||
| R | 2,566 | 4,672 | 7,360 | ||
| R | 2,564 | 5,661 | 8,292 | ||
| R | 3,102 | 4,423 | 7,872 | ||
| R | 3,691 | 3,764 | 7,807 | ||
| R | 10,648 | 21,897 | 33,435 | ||
| R | 1,568 | 2,942 | 6,743 | ||
| R | 1,765 | 1,820 | 3,590 | ||
| R | 1,805 | 2,169 | 3,999 | ||
| R | 1,388 | 1,908 | 3,539 | ||
| D | 1,657 | 1,640 | 3,308 | ||
| D | 1,242 | 570 | 1,981 | ||
| D | 1,284 | 368 | 1,657 | ||
| D | 981 | 308 | 1,290 | ||
| D | 1,309 | 332 | 1,651 | ||
| D | 957 | 342 | 1,320 | ||
| R | 482 | 505 | 987 | ||
| D | 277 | 206 | 491 | ||
| D | 97 | 41 | 139 | ||
| D | 24 | 3 | 28 | ||
| — | — | — | — | ||
| — | — | — | — | ||
| — | — | — | — | ||
| — | — | — | — | ||
| — | — | — | — | ||
| — | — | — | — | ||
| — | — | — | — | ||
| — | — | — | — | ||
| — | — | — | — | ||
| — | — | — | — |
Demographics
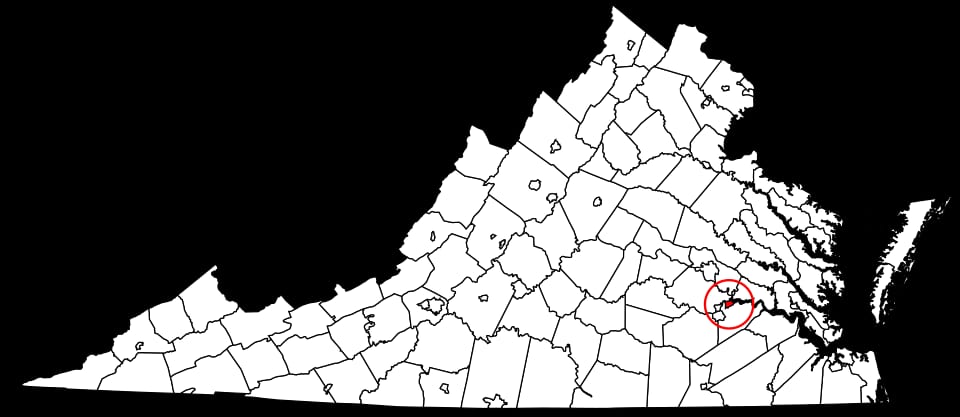
Hopewell, an independent city on the Appomattox River, has voted Democratic in recent presidential cycles by double-digit margins, reflecting its majority-minority population and legacy of chemical and manufacturing industry employment.
Its margins are typically close. The Democratic margin reached seventy-five points in 1916; the Republican margin reached thirty-seven points in 1984. Between 2020 and 2024 the county moved one point toward the Republican candidate; the 2024 margin was fourteen points.
Its demographics sit near national norms: a 41% non-Hispanic-white share, a median household income of $54,729, and a 22% poverty rate. The county's voting pattern over the last decade is most similar to that of Manassas city and Hamilton County.
Compare two places, side by side
Twelve curated comparisons line up election history, demographics, and the divergence story for two places at a glance. Browse all comparisons →
Hopewell city, Virginia. Akashic. https://akashic.app/county/51670/. Accessed May 20, 2026. License: CC BY 4.0.