Apache County, Arizona: New American county. In 2024, voted D+19%. Democratic peak: D+45 in 1936.
Key facts
- 2024 presidential margin
- D+19MIT Election Lab
- Political typology
- New AmericanAkashic typology
- Population
- 65,3412024 5-year
- Median household income
- $41,4382024 5-year
- White (non-Hispanic)
- 20.8%2024 5-year
- Black
- 1.0%2024 5-year
- Hispanic / Latino
- 6.4%2024 5-year
- Peak Democratic margin
- D+45 in 1936MIT Election Lab
- Peak Republican margin
- R+26 in 1956MIT Election Lab
- Most similar
- Hale County, AL · similarity 0.99
| Kamala Harris ✓Democratic | 58.8% | 18,872 |
|---|---|---|
| Donald TrumpRepublican | 39.9% | 12,795 |
| OtherAll other candidates | 1.3% | 429 |
| Year | Margin (D minus R) |
|---|---|
| 1876 | No data |
| 1880 | No data |
| 1884 | No data |
| 1888 | No data |
| 1892 | No data |
| 1896 | No data |
| 1900 | No data |
| 1904 | No data |
| 1908 | No data |
| 1912 | +20.4% |
| 1916 | +34.4% |
| 1920 | −4.7% |
| 1924 | −5.6% |
| 1928 | −2.8% |
| 1932 | +25.1% |
| 1936 | +44.5% |
| 1940 | +36.0% |
| 1944 | +25.9% |
| 1948 | +20.8% |
| 1952 | −19.4% |
| 1956 | −26.4% |
| 1960 | +0.8% |
| 1964 | +40.9% |
| 1968 | −10.1% |
| 1972 | −3.7% |
| 1976 | +30.4% |
| 1980 | −19.6% |
| 1984 | +12.6% |
| 1988 | +24.7% |
| 1992 | +36.3% |
| 1996 | +40.9% |
| 2000 | +36.4% |
| 2004 | +30.1% |
| 2008 | +28.2% |
| 2012 | +34.3% |
| 2016 | +32.0% |
| 2020 | +33.6% |
| 2024 | +18.9% |
| Year | Won | Margin | Democratic | Republican | Total |
|---|---|---|---|---|---|
| D | 18,872 | 12,795 | 32,096 | ||
| D | 23,293 | 11,442 | 35,268 | ||
| D | 17,083 | 8,240 | 27,661 | ||
| D | 17,147 | 8,250 | 25,917 | ||
| D | 15,390 | 8,551 | 24,262 | ||
| D | 15,658 | 8,384 | 24,198 | ||
| D | 13,025 | 5,947 | 19,456 | ||
| D | 12,394 | 4,761 | 18,684 | ||
| D | 11,218 | 4,588 | 18,258 | ||
| D | 8,944 | 5,347 | 14,544 | ||
| D | 7,277 | 5,638 | 13,032 | ||
| R | 3,917 | 5,991 | 10,595 | ||
| D | 6,583 | 3,447 | 10,327 | ||
| R | 3,145 | 3,394 | 6,750 | ||
| R | 1,668 | 2,092 | 4,198 | ||
| D | 1,750 | 734 | 2,484 | ||
| D | 1,086 | 1,069 | 2,155 | ||
| R | 981 | 1,685 | 2,667 | ||
| R | 1,193 | 1,767 | 2,960 | ||
| D | 1,480 | 970 | 2,455 | ||
| D | 1,238 | 728 | 1,968 | ||
| D | 1,969 | 926 | 2,898 | ||
| D | 1,674 | 638 | 2,327 | ||
| D | 1,271 | 760 | 2,034 | ||
| R | 791 | 837 | 1,628 | ||
| R | 548 | 620 | 1,278 | ||
| R | 618 | 679 | 1,297 | ||
| D | 648 | 311 | 980 | ||
| D | 108 | 56 | 255 | ||
| — | — | — | — | ||
| — | — | — | — | ||
| — | — | — | — | ||
| — | — | — | — | ||
| — | — | — | — | ||
| — | — | — | — | ||
| — | — | — | — | ||
| — | — | — | — | ||
| — | — | — | — |
Demographics
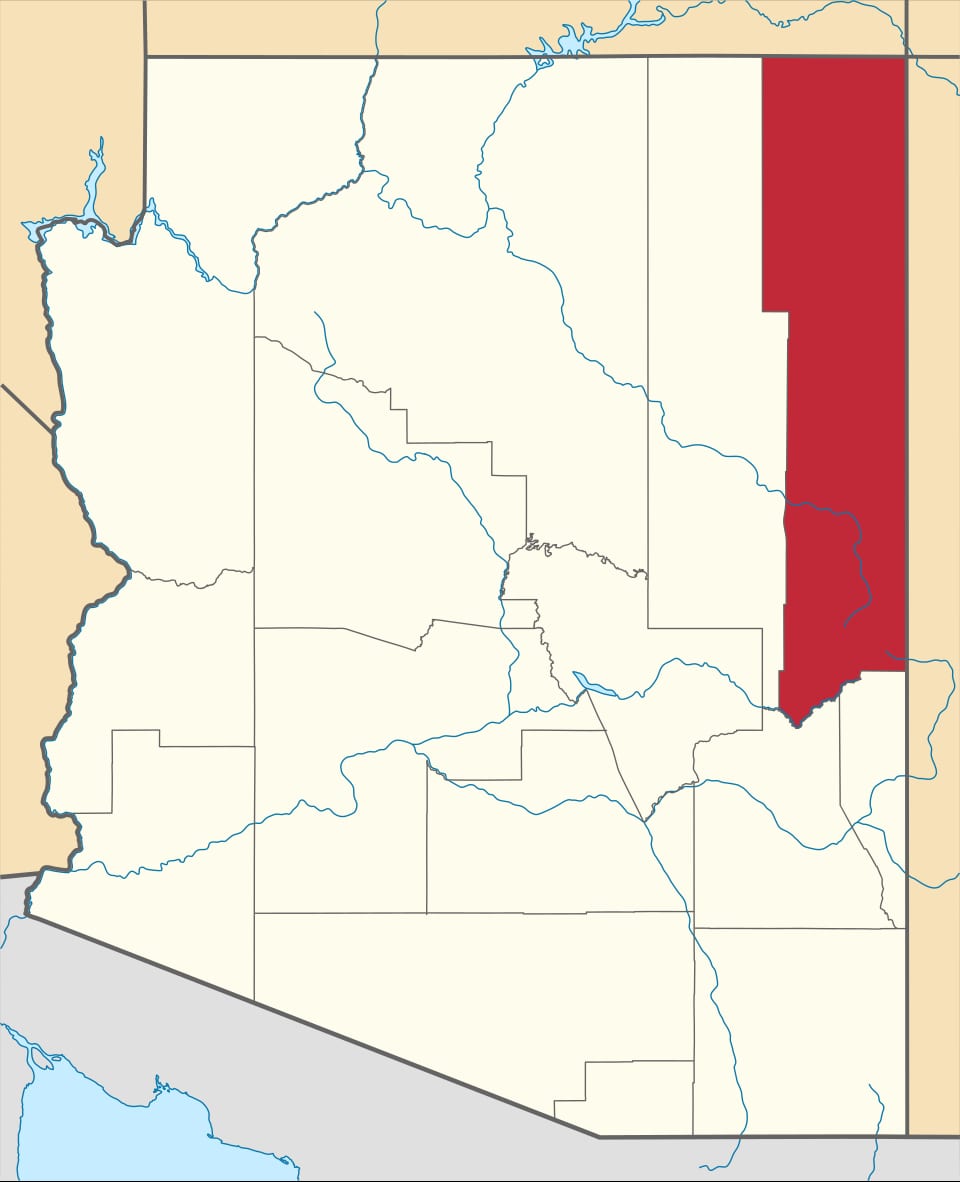
Apache County's electorate is shaped by the Navajo and Hopi nations, which together cover most of its land area and account for the Democratic-leaning margins that have defined its presidential results for decades.
Apache County has leaned Democratic in recent presidential elections, reaching a Democratic margin of forty-five points in 1936. Between 2020 and 2024 it moved fifteen points toward the Republican candidate — part of the sharpest rightward shift recorded among any group of places in the country.
Its demographics describe the shift: a 21% non-Hispanic-white share, a median household income of $41,438, and a population of 65,341. The county's voting pattern over the last decade is most similar to that of Hale County and Hancock County.
Compare two places, side by side
Twelve curated comparisons line up election history, demographics, and the divergence story for two places at a glance. Browse all comparisons →
Apache County, Arizona. Akashic. https://akashic.app/county/04001/. Accessed May 20, 2026. License: CC BY 4.0.