Pima County, Arizona: New American county. In 2024, voted D+15%. Democratic peak: D+33 in 1936.
Key facts
- 2024 presidential margin
- D+15MIT Election Lab
- Political typology
- New AmericanAkashic typology
- Population
- 1,060,4902024 5-year
- Median household income
- $70,3152024 5-year
- White (non-Hispanic)
- 59.2%2024 5-year
- Black
- 3.6%2024 5-year
- Hispanic / Latino
- 36.4%2024 5-year
- Peak Democratic margin
- D+33 in 1936MIT Election Lab
- Peak Republican margin
- R+25 in 1956MIT Election Lab
- Most similar
- Barnstable County, MA · similarity 0.98
| Kamala Harris ✓Democratic | 56.8% | 292,450 |
|---|---|---|
| Donald TrumpRepublican | 41.7% | 214,669 |
| OtherAll other candidates | 1.5% | 7,908 |
| Year | Margin (D minus R) |
|---|---|
| 1876 | No data |
| 1880 | No data |
| 1884 | No data |
| 1888 | No data |
| 1892 | No data |
| 1896 | No data |
| 1900 | No data |
| 1904 | No data |
| 1908 | No data |
| 1912 | +18.8% |
| 1916 | −10.9% |
| 1920 | −16.0% |
| 1924 | −11.4% |
| 1928 | −14.2% |
| 1932 | +27.7% |
| 1936 | +33.2% |
| 1940 | +19.5% |
| 1944 | +9.0% |
| 1948 | +2.0% |
| 1952 | −20.4% |
| 1956 | −25.1% |
| 1960 | −5.1% |
| 1964 | +7.1% |
| 1968 | −9.9% |
| 1972 | −10.5% |
| 1976 | −3.9% |
| 1980 | −15.3% |
| 1984 | −14.8% |
| 1988 | −1.7% |
| 1992 | +11.2% |
| 1996 | +12.8% |
| 2000 | +8.0% |
| 2004 | +6.0% |
| 2008 | +6.1% |
| 2012 | +6.9% |
| 2016 | +13.6% |
| 2020 | +18.6% |
| 2024 | +15.1% |
| Year | Won | Margin | Democratic | Republican | Total |
|---|---|---|---|---|---|
| D | 292,450 | 214,669 | 515,027 | ||
| D | 304,981 | 207,758 | 522,174 | ||
| D | 224,661 | 167,428 | 421,640 | ||
| D | 201,251 | 174,779 | 383,173 | ||
| D | 206,254 | 182,406 | 393,428 | ||
| D | 193,128 | 171,109 | 367,492 | ||
| D | 147,688 | 124,579 | 287,640 | ||
| D | 137,983 | 104,121 | 264,552 | ||
| D | 128,569 | 97,036 | 281,484 | ||
| R | 113,824 | 117,899 | 234,473 | ||
| R | 91,585 | 123,830 | 217,612 | ||
| R | 64,418 | 93,055 | 187,057 | ||
| R | 71,214 | 77,264 | 155,061 | ||
| R | 56,223 | 73,154 | 161,110 | ||
| R | 39,786 | 49,479 | 97,766 | ||
| D | 54,120 | 46,955 | 101,278 | ||
| R | 42,171 | 46,734 | 89,144 | ||
| R | 23,536 | 39,298 | 62,885 | ||
| R | 21,237 | 32,113 | 53,350 | ||
| D | 17,692 | 16,968 | 35,625 | ||
| D | 13,006 | 10,850 | 23,913 | ||
| D | 14,035 | 9,445 | 23,562 | ||
| D | 12,249 | 6,079 | 18,590 | ||
| D | 11,061 | 6,152 | 17,727 | ||
| R | 4,976 | 6,635 | 11,653 | ||
| R | 2,594 | 3,559 | 8,439 | ||
| R | 2,455 | 3,392 | 5,847 | ||
| R | 2,079 | 2,616 | 4,922 | ||
| O | 693 | 353 | 1,804 | ||
| — | — | — | — | ||
| — | — | — | — | ||
| — | — | — | — | ||
| — | — | — | — | ||
| — | — | — | — | ||
| — | — | — | — | ||
| — | — | — | — | ||
| — | — | — | — | ||
| — | — | — | — |
Demographics
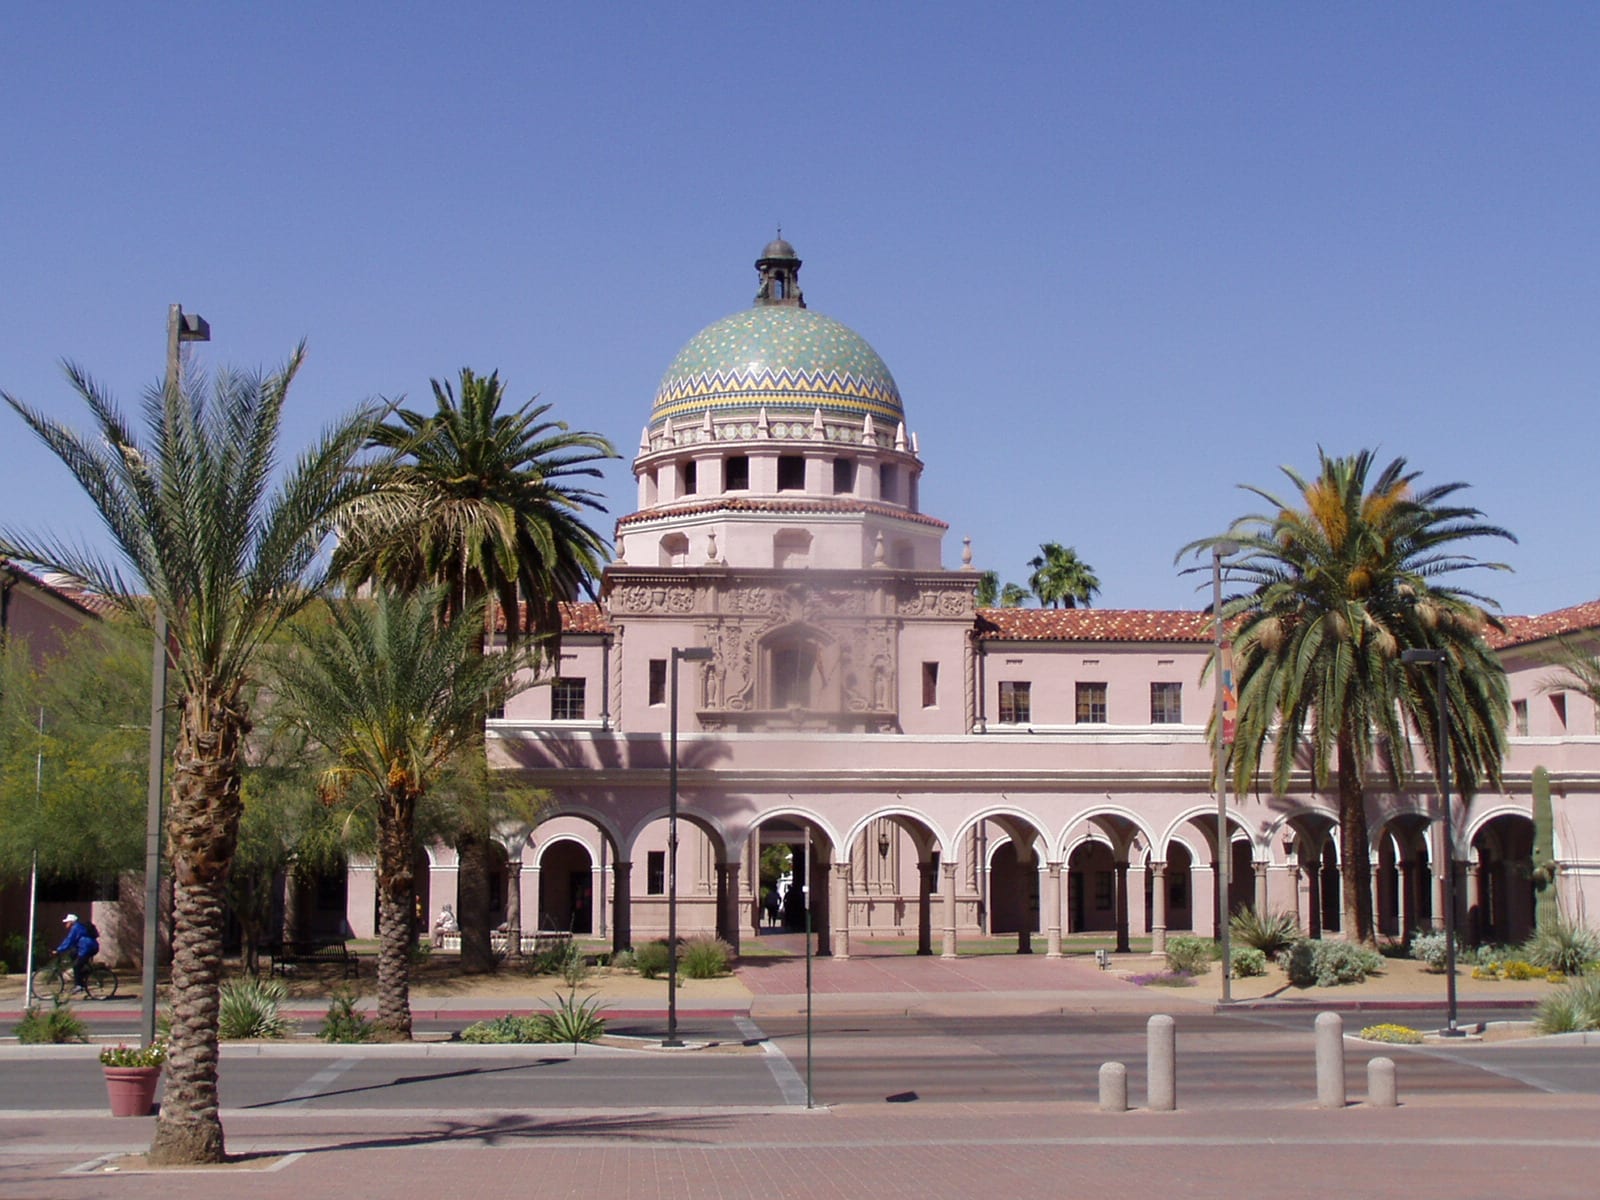
Home to the University of Arizona and a majority-minority population, Pima County has voted Democratic in every presidential race since 1996, with margins widening steadily as Tucson's metro core has grown relative to its rural fringe.
Pima County has leaned Democratic in recent presidential elections, reaching a Democratic margin of thirty-three points in 1936. Between 2020 and 2024 it moved four points toward the Republican candidate — part of the sharpest rightward shift recorded among any group of places in the country.
Its demographics describe the shift: a 59% non-Hispanic-white share, a median household income of $70,315, and a population of 1,060,490. The county's voting pattern over the last decade is most similar to that of Barnstable County and Davidson County.
Compare two places, side by side
Twelve curated comparisons line up election history, demographics, and the divergence story for two places at a glance. Browse all comparisons →
Pima County, Arizona. Akashic. https://akashic.app/county/04019/. Accessed May 20, 2026. License: CC BY 4.0.