Alameda County, California: New American county. In 2024, voted D+54%. Democratic peak: D+64 in 2016.
Key facts
- 2024 presidential margin
- D+54MIT Election Lab
- Political typology
- New AmericanAkashic typology
- Population
- 1,649,4732024 5-year
- Median household income
- $129,3672024 5-year
- White (non-Hispanic)
- 29.8%2024 5-year
- Black
- 9.6%2024 5-year
- Hispanic / Latino
- 23.4%2024 5-year
- Peak Democratic margin
- D+64 in 2016MIT Election Lab
- Peak Republican margin
- R+55 in 1924MIT Election Lab
- Most similar
- Holmes County, MS · similarity 1.00
| Kamala Harris ✓Democratic | 74.6% | 499,551 |
|---|---|---|
| Donald TrumpRepublican | 21.0% | 140,789 |
| OtherAll other candidates | 4.4% | 29,460 |
| Year | Margin (D minus R) |
|---|---|
| 1876 | −19.2% |
| 1880 | −20.2% |
| 1884 | −22.1% |
| 1888 | −20.4% |
| 1892 | −9.1% |
| 1896 | −22.7% |
| 1900 | −34.5% |
| 1904 | −54.1% |
| 1908 | −42.9% |
| 1912 | +36.7% |
| 1916 | −7.5% |
| 1920 | −48.8% |
| 1924 | −55.4% |
| 1928 | −31.8% |
| 1932 | +8.4% |
| 1936 | +28.5% |
| 1940 | +11.6% |
| 1944 | +15.9% |
| 1948 | +1.2% |
| 1952 | −5.2% |
| 1956 | −5.1% |
| 1960 | +8.4% |
| 1964 | +33.0% |
| 1968 | +16.3% |
| 1972 | +12.2% |
| 1976 | +19.8% |
| 1980 | +10.3% |
| 1984 | +18.6% |
| 1988 | +30.8% |
| 1992 | +42.4% |
| 1996 | +42.7% |
| 2000 | +45.2% |
| 2004 | +51.9% |
| 2008 | +59.3% |
| 2012 | +60.6% |
| 2016 | +63.5% |
| 2020 | +62.2% |
| 2024 | +53.6% |
| Year | Won | Margin | Democratic | Republican | Total |
|---|---|---|---|---|---|
| D | 499,551 | 140,789 | 669,800 | ||
| D | 617,659 | 136,309 | 773,753 | ||
| D | 514,842 | 95,922 | 659,543 | ||
| D | 469,684 | 108,182 | 596,893 | ||
| D | 489,106 | 119,555 | 622,913 | ||
| D | 422,585 | 130,911 | 562,090 | ||
| D | 342,889 | 119,279 | 494,336 | ||
| D | 303,903 | 106,581 | 462,044 | ||
| D | 334,224 | 109,292 | 530,145 | ||
| D | 310,283 | 162,815 | 478,997 | ||
| D | 282,041 | 192,408 | 480,874 | ||
| D | 201,720 | 158,531 | 417,617 | ||
| D | 235,988 | 155,280 | 407,681 | ||
| D | 259,254 | 201,862 | 471,195 | ||
| D | 219,545 | 153,285 | 407,349 | ||
| D | 283,833 | 142,998 | 427,340 | ||
| D | 217,172 | 183,354 | 402,000 | ||
| R | 174,033 | 192,911 | 368,131 | ||
| R | 173,853 | 192,941 | 369,776 | ||
| D | 154,549 | 150,588 | 323,331 | ||
| D | 169,631 | 122,982 | 293,987 | ||
| D | 148,224 | 116,961 | 268,496 | ||
| D | 149,323 | 82,352 | 234,686 | ||
| D | 106,388 | 89,303 | 204,452 | ||
| R | 60,875 | 118,539 | 181,194 | ||
| R | 8,020 | 81,454 | 132,490 | ||
| R | 21,468 | 73,177 | 105,889 | ||
| R | 43,748 | 51,417 | 102,131 | ||
| O | 24,418 | 0 | 66,452 | ||
| R | 7,110 | 21,380 | 33,283 | ||
| R | 4,399 | 19,065 | 27,110 | ||
| R | 6,677 | 14,324 | 22,159 | ||
| R | 8,394 | 13,429 | 22,223 | ||
| R | 7,114 | 8,792 | 18,470 | ||
| R | 5,693 | 8,840 | 15,461 | ||
| R | 4,734 | 7,471 | 12,398 | ||
| R | 3,894 | 5,897 | 9,897 | ||
| R | 3,347 | 4,938 | 8,297 |
Demographics
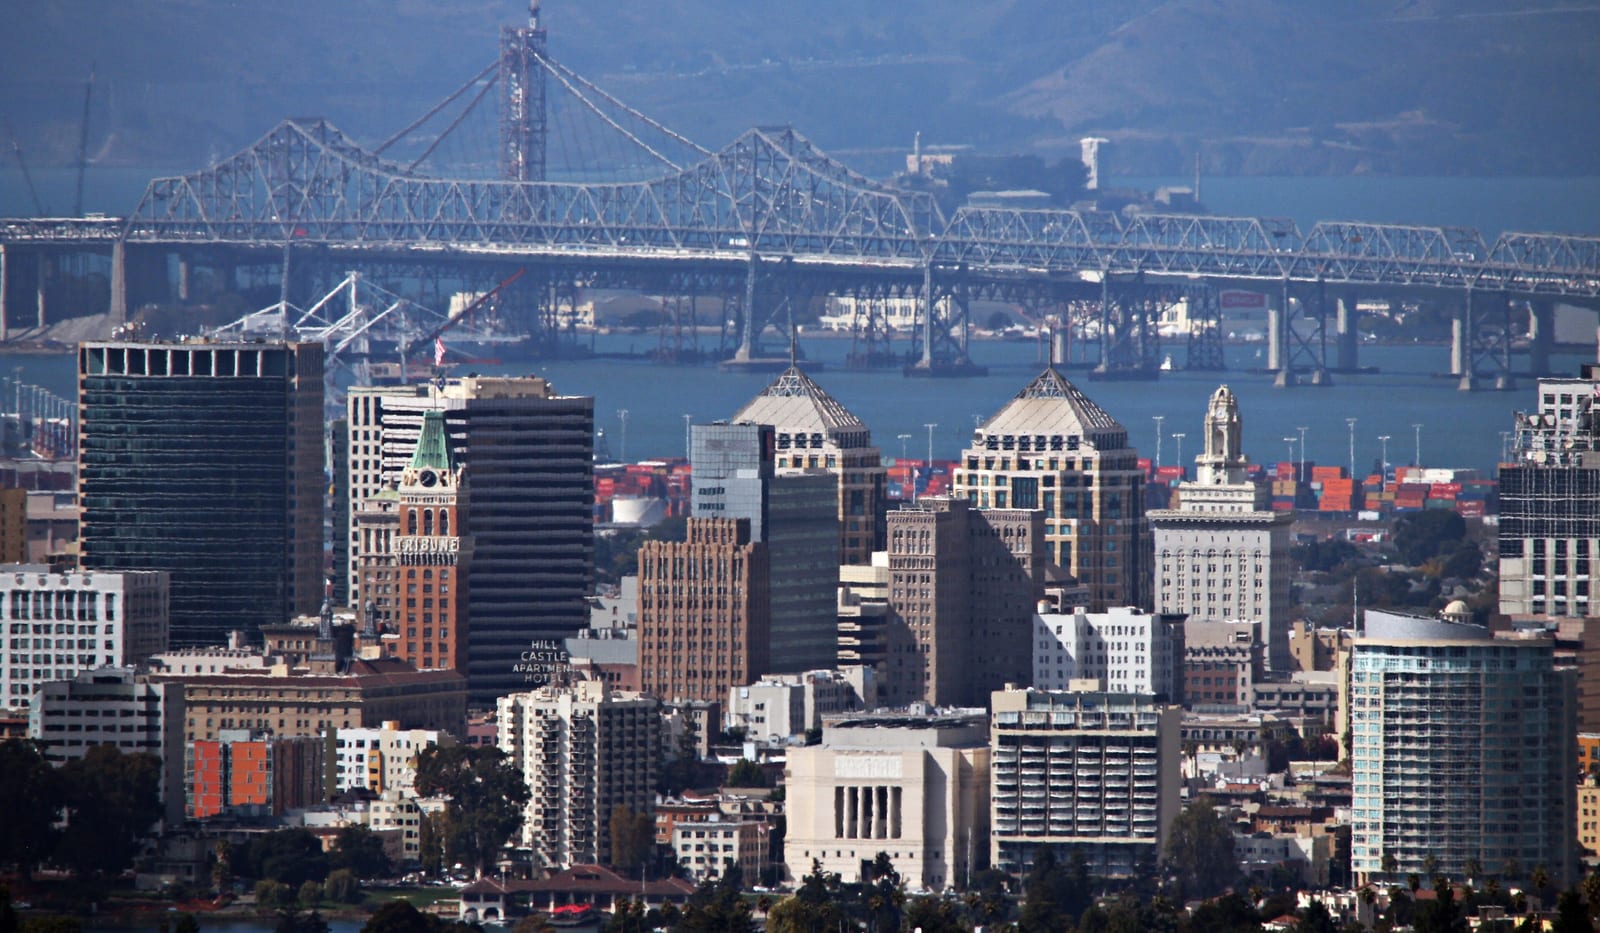
Alameda's dense urban core around Oakland and Berkeley anchors a Democratic presidential margin that has exceeded 50 points in recent cycles, making it a reliable high-turnout base rather than a competitive battleground.
Alameda County has leaned Democratic in recent presidential elections, reaching a Democratic margin of sixty-four points in 2016. Between 2020 and 2024 it moved nine points toward the Republican candidate — part of the sharpest rightward shift recorded among any group of places in the country.
Its demographics describe the shift: a 30% non-Hispanic-white share, a median household income of $129,367, and a population of 1,649,473. The county's voting pattern over the last decade is most similar to that of Holmes County and Santa Fe County.
Compare two places, side by side
Twelve curated comparisons line up election history, demographics, and the divergence story for two places at a glance. Browse all comparisons →
Alameda County, California. Akashic. https://akashic.app/county/06001/. Accessed May 20, 2026. License: CC BY 4.0.