Grant County, New Mexico: New American county. In 2024, voted D+5%. Democratic peak: D+44 in 1964.
Key facts
- 2024 presidential margin
- D+5MIT Election Lab
- Political typology
- New AmericanAkashic typology
- Population
- 27,7752024 5-year
- Median household income
- $44,9582024 5-year
- White (non-Hispanic)
- 62.2%2024 5-year
- Black
- 0.8%2024 5-year
- Hispanic / Latino
- 47.8%2024 5-year
- Peak Democratic margin
- D+44 in 1964MIT Election Lab
- Peak Republican margin
- R+8 in 1920MIT Election Lab
- Most similar
- St. Clair County, IL · similarity 0.98
| Kamala Harris ✓Democratic | 51.3% | 7,301 |
|---|---|---|
| Donald TrumpRepublican | 46.3% | 6,580 |
| OtherAll other candidates | 2.4% | 343 |
| Year | Margin (D minus R) |
|---|---|
| 1876 | No data |
| 1880 | No data |
| 1884 | No data |
| 1888 | No data |
| 1892 | No data |
| 1896 | No data |
| 1900 | No data |
| 1904 | No data |
| 1908 | No data |
| 1912 | +32.6% |
| 1916 | +10.2% |
| 1920 | −8.5% |
| 1924 | +7.4% |
| 1928 | −1.6% |
| 1932 | +40.9% |
| 1936 | +36.9% |
| 1940 | +32.0% |
| 1944 | +27.6% |
| 1948 | +27.8% |
| 1952 | +11.3% |
| 1956 | +12.2% |
| 1960 | +27.8% |
| 1964 | +43.9% |
| 1968 | +12.0% |
| 1972 | −4.0% |
| 1976 | +11.6% |
| 1980 | −0.3% |
| 1984 | +7.2% |
| 1988 | +12.8% |
| 1992 | +26.1% |
| 1996 | +17.1% |
| 2000 | +6.3% |
| 2004 | +7.2% |
| 2008 | +19.9% |
| 2012 | +13.4% |
| 2016 | +7.7% |
| 2020 | +7.2% |
| 2024 | +5.1% |
| Year | Won | Margin | Democratic | Republican | Total |
|---|---|---|---|---|---|
| D | 7,301 | 6,580 | 14,224 | ||
| D | 7,590 | 6,553 | 14,435 | ||
| D | 6,276 | 5,288 | 12,811 | ||
| D | 7,090 | 5,358 | 12,902 | ||
| D | 8,142 | 5,406 | 13,755 | ||
| D | 7,095 | 6,135 | 13,392 | ||
| D | 5,673 | 4,961 | 11,241 | ||
| D | 5,860 | 3,993 | 10,928 | ||
| D | 5,603 | 2,917 | 10,277 | ||
| D | 5,443 | 4,196 | 9,735 | ||
| D | 5,755 | 4,979 | 10,840 | ||
| R | 4,600 | 4,628 | 9,761 | ||
| D | 5,176 | 4,095 | 9,328 | ||
| R | 4,081 | 4,431 | 8,781 | ||
| D | 3,817 | 2,908 | 7,549 | ||
| D | 5,253 | 2,042 | 7,314 | ||
| D | 4,378 | 2,468 | 6,868 | ||
| D | 4,122 | 3,224 | 7,377 | ||
| D | 4,315 | 3,421 | 7,922 | ||
| D | 3,592 | 1,999 | 5,727 | ||
| D | 3,472 | 1,970 | 5,446 | ||
| D | 3,914 | 2,015 | 5,930 | ||
| D | 3,215 | 1,469 | 4,736 | ||
| D | 3,344 | 1,381 | 4,795 | ||
| R | 1,994 | 2,058 | 4,060 | ||
| D | 2,085 | 1,756 | 4,436 | ||
| R | 1,879 | 2,230 | 4,148 | ||
| D | 2,305 | 1,869 | 4,274 | ||
| D | 1,130 | 439 | 2,119 | ||
| — | — | — | — | ||
| — | — | — | — | ||
| — | — | — | — | ||
| — | — | — | — | ||
| — | — | — | — | ||
| — | — | — | — | ||
| — | — | — | — | ||
| — | — | — | — | ||
| — | — | — | — |
Demographics
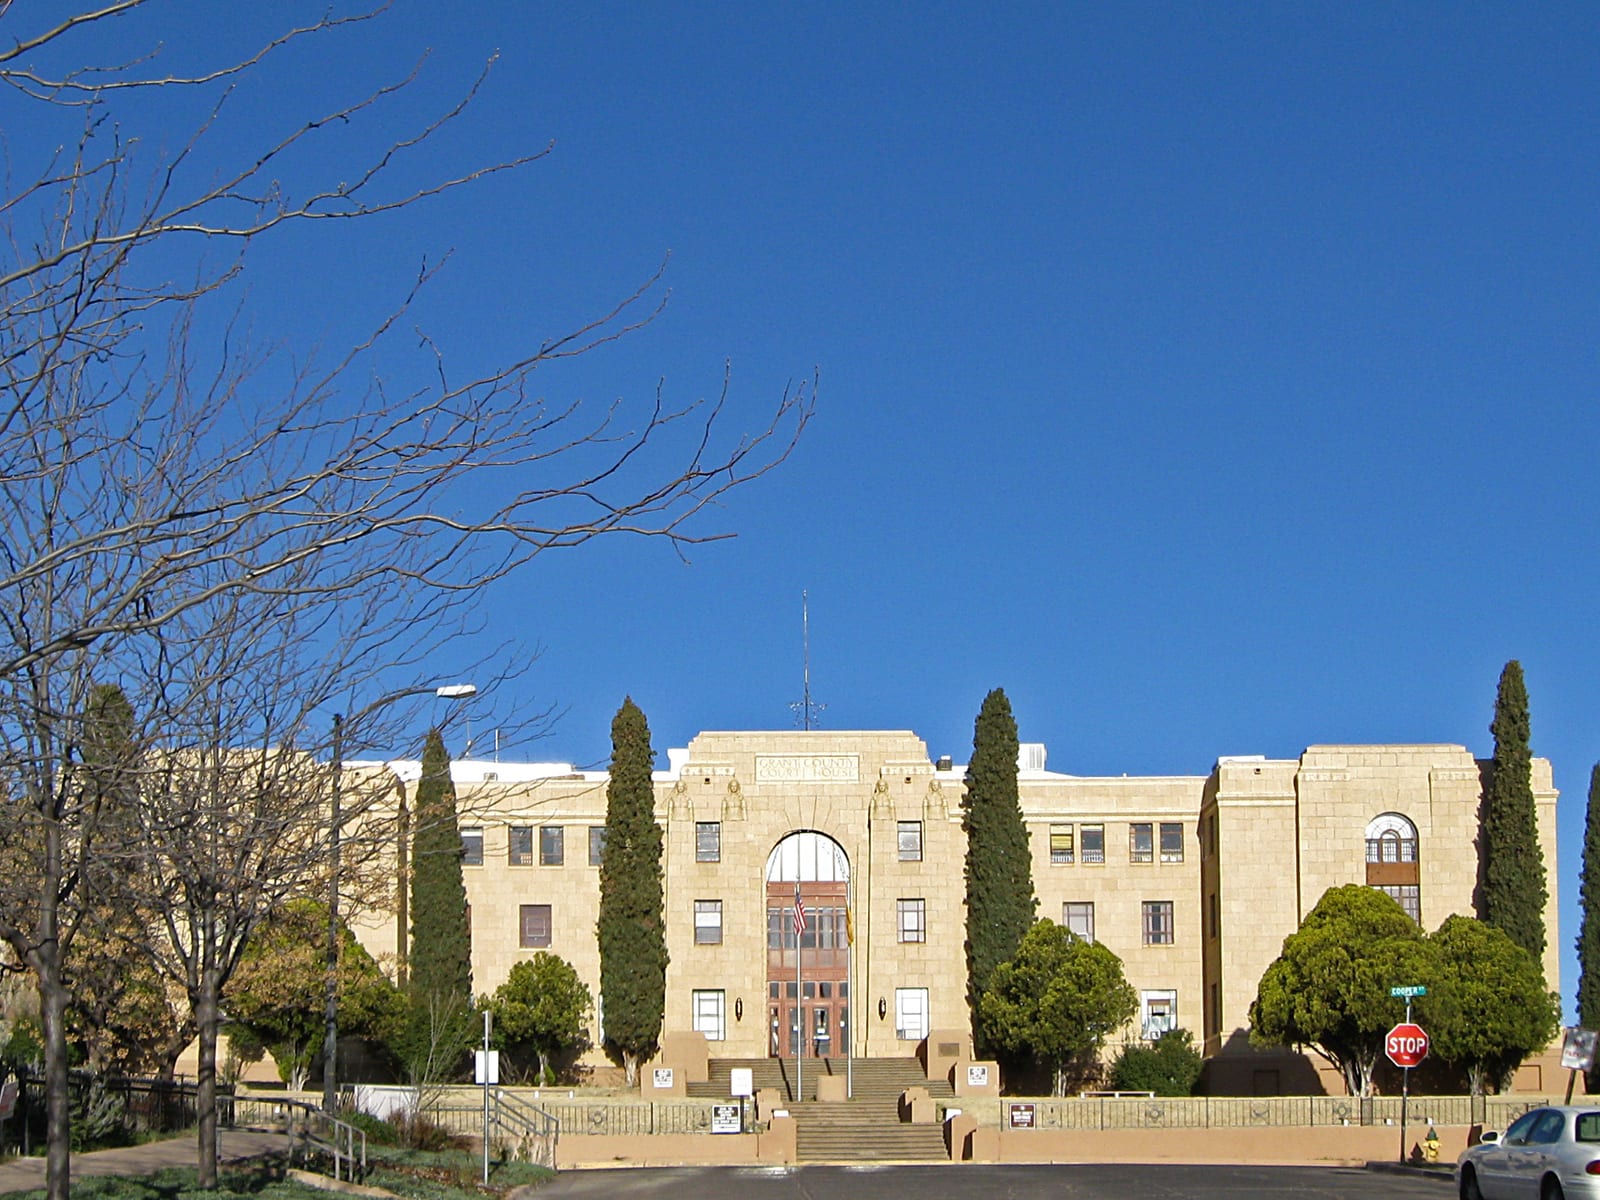
Grant County's economy has long orbited the copper industry around Silver City, producing a blue-collar demographic mix that keeps presidential margins closer than in most of the state's rural south — the 2024 result landed at D+5.1.
Grant County has leaned Democratic in recent presidential elections, reaching a Democratic margin of forty-four points in 1964. Between 2020 and 2024 it moved two points toward the Republican candidate — part of the sharpest rightward shift recorded among any group of places in the country.
Its demographics describe the shift: a 62% non-Hispanic-white share, a median household income of $44,958, and a population of 27,775. The county's voting pattern over the last decade is most similar to that of St. Clair County and Calhoun County.
Compare two places, side by side
Twelve curated comparisons line up election history, demographics, and the divergence story for two places at a glance. Browse all comparisons →
Grant County, New Mexico. Akashic. https://akashic.app/county/35017/. Accessed May 20, 2026. License: CC BY 4.0.