Morrow County, Oregon: New American county. In 2024, voted R+48%. Republican peak: R+48 in 1904.
Key facts
- 2024 presidential margin
- R+48MIT Election Lab
- Political typology
- New AmericanAkashic typology
- Population
- 12,3002024 5-year
- Median household income
- $75,4482024 5-year
- White (non-Hispanic)
- 59.2%2024 5-year
- Black
- 0.8%2024 5-year
- Hispanic / Latino
- 42.0%2024 5-year
- Peak Democratic margin
- D+40 in 1964MIT Election Lab
- Peak Republican margin
- R+48 in 1904MIT Election Lab
- Most similar
- White Pine County, NV · similarity 1.00
| Donald Trump ✓Republican | 72.0% | 3,408 |
|---|---|---|
| Kamala HarrisDemocratic | 24.0% | 1,138 |
| OtherAll other candidates | 3.9% | 186 |
| Year | Margin (D minus R) |
|---|---|
| 1876 | No data |
| 1880 | No data |
| 1884 | No data |
| 1888 | No data |
| 1892 | −10.4% |
| 1896 | −3.7% |
| 1900 | −31.6% |
| 1904 | −48.0% |
| 1908 | −37.3% |
| 1912 | −16.4% |
| 1916 | +4.8% |
| 1920 | −42.6% |
| 1924 | −32.0% |
| 1928 | −32.6% |
| 1932 | +21.9% |
| 1936 | +35.4% |
| 1940 | +12.6% |
| 1944 | +5.6% |
| 1948 | +5.4% |
| 1952 | −22.9% |
| 1956 | −10.0% |
| 1960 | +1.8% |
| 1964 | +40.2% |
| 1968 | −13.8% |
| 1972 | −17.0% |
| 1976 | +3.0% |
| 1980 | −20.7% |
| 1984 | −25.8% |
| 1988 | −5.2% |
| 1992 | −0.4% |
| 1996 | +1.4% |
| 2000 | −28.5% |
| 2004 | −33.0% |
| 2008 | −27.1% |
| 2012 | −34.3% |
| 2016 | −40.9% |
| 2020 | −43.3% |
| 2024 | −48.0% |
| Year | Won | Margin | Democratic | Republican | Total |
|---|---|---|---|---|---|
| R | 1,138 | 3,408 | 4,732 | ||
| R | 1,371 | 3,586 | 5,118 | ||
| R | 1,017 | 2,721 | 4,167 | ||
| R | 1,202 | 2,532 | 3,882 | ||
| R | 1,410 | 2,509 | 4,058 | ||
| R | 1,361 | 2,732 | 4,149 | ||
| R | 1,197 | 2,224 | 3,609 | ||
| D | 1,426 | 1,381 | 3,331 | ||
| R | 1,174 | 1,187 | 3,474 | ||
| R | 1,375 | 1,529 | 2,970 | ||
| R | 1,254 | 2,130 | 3,397 | ||
| R | 1,077 | 1,728 | 3,141 | ||
| D | 1,162 | 1,091 | 2,367 | ||
| R | 718 | 1,059 | 2,007 | ||
| R | 797 | 1,068 | 1,967 | ||
| D | 1,470 | 627 | 2,097 | ||
| D | 1,039 | 1,003 | 2,042 | ||
| R | 893 | 1,092 | 1,985 | ||
| R | 786 | 1,254 | 2,045 | ||
| D | 838 | 751 | 1,622 | ||
| D | 836 | 747 | 1,596 | ||
| D | 979 | 758 | 1,749 | ||
| D | 1,181 | 518 | 1,874 | ||
| D | 929 | 579 | 1,601 | ||
| R | 543 | 1,093 | 1,685 | ||
| R | 397 | 991 | 1,858 | ||
| R | 451 | 1,186 | 1,725 | ||
| D | 830 | 748 | 1,697 | ||
| R | 275 | 447 | 1,050 | ||
| R | 272 | 680 | 1,095 | ||
| R | 230 | 875 | 1,344 | ||
| R | 358 | 723 | 1,154 | ||
| R | 544 | 586 | 1,150 | ||
| R | 352 | 470 | 1,136 | ||
| — | — | — | — | ||
| — | — | — | — | ||
| — | — | — | — | ||
| — | — | — | — |
Demographics
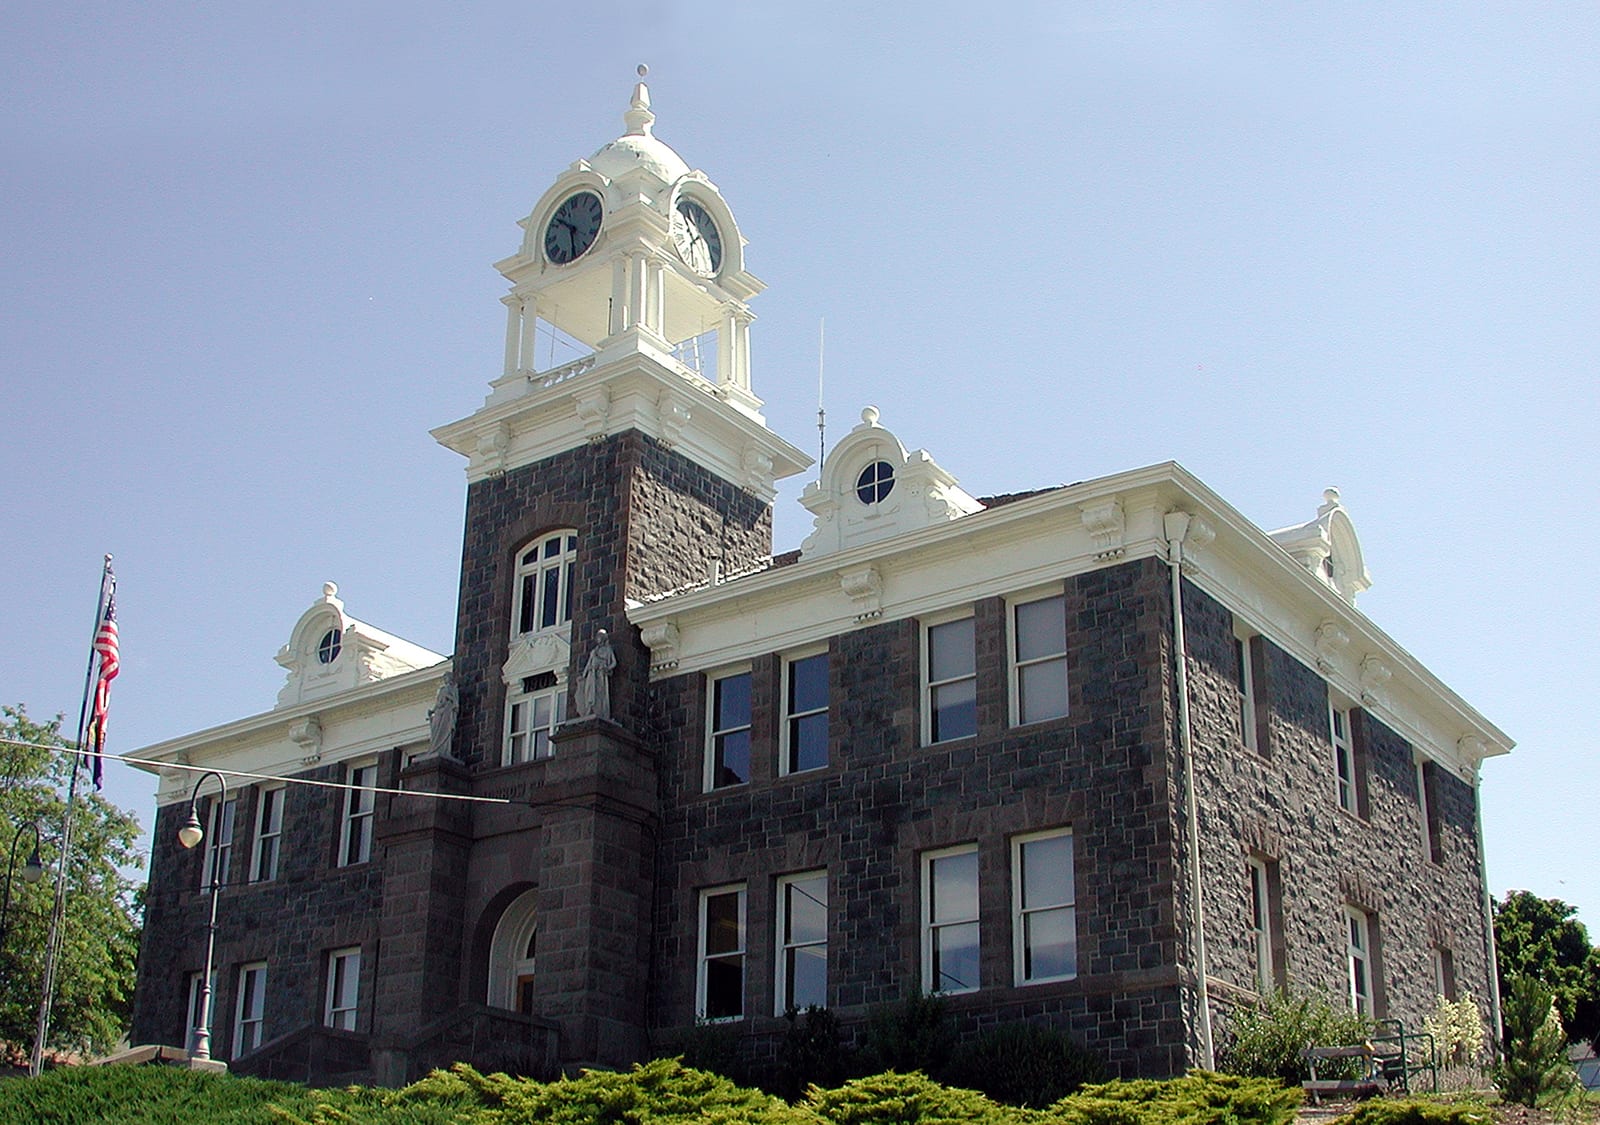
Morrow County's sparse, ranch-and-farm landscape anchors a Republican tilt that reached 48 points in 2024, making it an outlier even within a state where rural eastern counties trend heavily red.
Morrow County has leaned Republican in recent presidential elections, reaching a Democratic margin of forty points in 1964. Between 2020 and 2024 it moved five points toward the Republican candidate — part of the sharpest rightward shift recorded among any group of places in the country.
Its demographics describe the shift: a 59% non-Hispanic-white share, a median household income of $75,448, and a population of 12,300. The county's voting pattern over the last decade is most similar to that of White Pine County and Hill County.
Compare two places, side by side
Twelve curated comparisons line up election history, demographics, and the divergence story for two places at a glance. Browse all comparisons →
Morrow County, Oregon. Akashic. https://akashic.app/county/41049/. Accessed May 20, 2026. License: CC BY 4.0.