Hernando County, Florida: Florida Surge county. In 2024, voted R+37%. Democratic peak: D+82 in 1900.
Key facts
- 2024 presidential margin
- R+37MIT Election Lab
- Political typology
- Florida SurgeAkashic typology
- Population
- 207,0182024 5-year
- Median household income
- $66,0582024 5-year
- White (non-Hispanic)
- 76.3%2024 5-year
- Black
- 4.9%2024 5-year
- Hispanic / Latino
- 17.0%2024 5-year
- Peak Democratic margin
- D+82 in 1900MIT Election Lab
- Peak Republican margin
- R+50 in 1972MIT Election Lab
- Most similar
- St. Clair County, MI · similarity 0.98
| Donald Trump ✓Republican | 68.2% | 75,435 |
|---|---|---|
| Kamala HarrisDemocratic | 31.1% | 34,418 |
| OtherAll other candidates | 0.7% | 814 |
| Year | Margin (D minus R) |
|---|---|
| 1876 | No data |
| 1880 | No data |
| 1884 | +58.8% |
| 1888 | No data |
| 1892 | +73.2% |
| 1896 | +69.8% |
| 1900 | +81.8% |
| 1904 | +79.6% |
| 1908 | +59.9% |
| 1912 | +66.3% |
| 1916 | +72.9% |
| 1920 | +59.9% |
| 1924 | +60.1% |
| 1928 | +2.9% |
| 1932 | +61.9% |
| 1936 | +56.2% |
| 1940 | +50.3% |
| 1944 | +48.7% |
| 1948 | +23.0% |
| 1952 | −7.3% |
| 1956 | +5.1% |
| 1960 | +4.0% |
| 1964 | −0.4% |
| 1968 | −8.9% |
| 1972 | −49.8% |
| 1976 | +14.0% |
| 1980 | −14.8% |
| 1984 | −27.1% |
| 1988 | −15.6% |
| 1992 | +2.6% |
| 1996 | +11.2% |
| 2000 | +3.1% |
| 2004 | −6.8% |
| 2008 | −3.6% |
| 2012 | −8.5% |
| 2016 | −29.0% |
| 2020 | −30.2% |
| 2024 | −37.1% |
| Year | Won | Margin | Democratic | Republican | Total |
|---|---|---|---|---|---|
| R | 34,418 | 75,435 | 110,667 | ||
| R | 37,519 | 70,412 | 108,922 | ||
| R | 31,795 | 58,970 | 93,796 | ||
| R | 37,830 | 44,938 | 83,667 | ||
| R | 41,886 | 45,021 | 87,901 | ||
| R | 37,187 | 42,635 | 80,547 | ||
| D | 32,648 | 30,658 | 65,236 | ||
| D | 28,524 | 22,046 | 58,066 | ||
| D | 19,174 | 17,902 | 49,086 | ||
| R | 15,437 | 21,195 | 36,863 | ||
| R | 12,204 | 21,279 | 33,487 | ||
| R | 8,858 | 12,115 | 22,032 | ||
| D | 7,717 | 5,793 | 13,732 | ||
| R | 2,110 | 6,296 | 8,409 | ||
| O | 1,524 | 2,053 | 5,964 | ||
| R | 2,320 | 2,337 | 4,657 | ||
| D | 1,960 | 1,809 | 3,769 | ||
| D | 1,435 | 1,295 | 2,730 | ||
| R | 1,104 | 1,279 | 2,383 | ||
| D | 825 | 441 | 1,672 | ||
| D | 1,002 | 346 | 1,348 | ||
| D | 1,151 | 381 | 1,532 | ||
| D | 1,115 | 313 | 1,428 | ||
| D | 1,097 | 258 | 1,355 | ||
| D | 701 | 661 | 1,383 | ||
| D | 300 | 59 | 401 | ||
| D | 622 | 132 | 818 | ||
| D | 446 | 38 | 560 | ||
| D | 272 | 18 | 383 | ||
| D | 260 | 57 | 339 | ||
| D | 172 | 12 | 201 | ||
| D | 252 | 18 | 286 | ||
| D | 231 | 37 | 278 | ||
| D | 227 | 0 | 310 | ||
| — | — | — | — | ||
| D | 1,040 | 270 | 1,310 | ||
| — | — | — | — | ||
| — | — | — | — |
Demographics
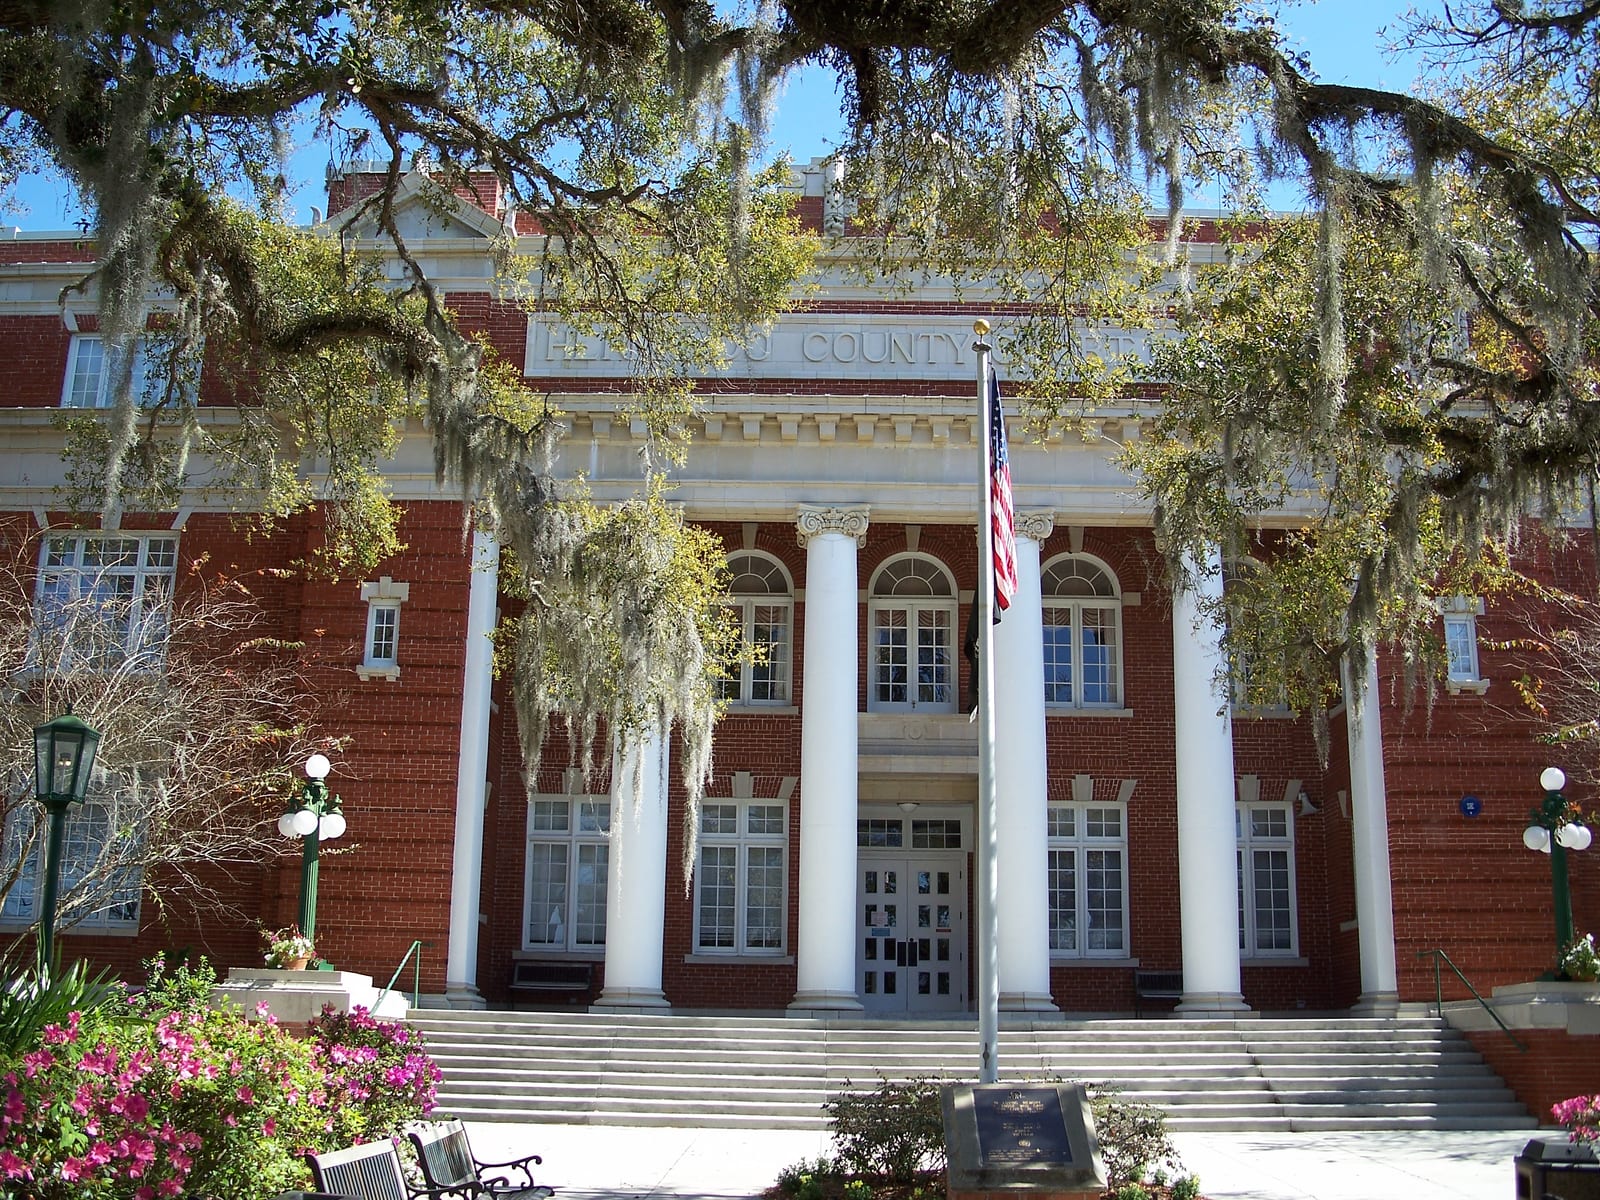
Hernando County's population has grown steadily through retiree in-migration from Tampa's northern sprawl, and that demographic shift has coincided with a 37-point Republican presidential margin in 2024—among the largest in the I-75 corridor.
The Democratic margin here once reached eighty-two points in 1900. Between 2020 and 2024 the county moved seven points toward the Republican candidate; the 2024 margin was thirty-seven points.
A population of 207,018, a 76% non-Hispanic-white share, and a median household income of $66,058 describe the county. The county's voting pattern over the last decade is most similar to that of St. Clair County and Pasco County.
Compare two places, side by side
Twelve curated comparisons line up election history, demographics, and the divergence story for two places at a glance. Browse all comparisons →
Hernando County, Florida. Akashic. https://akashic.app/county/12053/. Accessed May 20, 2026. License: CC BY 4.0.